Kitchin and presidential cycles
Divide a
Juglar or an Armstrong cycle by two and you get what is known as Kitchin cycle,
a 4 to 4.5 year cycle, also known as the “presidential cycle”, because it
coincides with the electoral clock of the United States, the world’s leading
economy and home of the world’s reserve currency.

There is no
doubt that the interactions between the fiscal and monetary cycles are major
factors in monetary aggregates and as such do influence the US dollar and
therefore pretty much every asset classes.

That said,
whether the political cycle is the cause or the result of a wider and more
complex socio-economic machine remains a matter of debate.
Politicians
would be the first to take credit for any economic upswings and blame the downturn
on the cycle itself.
Like Kondratieff
in his times, the purpose of this post is not to explain, but to expose a cycle
that effectively corresponds to the bull-bear cycles of most equity markets and
therefore, the average length of bull markets being 3.5-4 years and the average
length of bear markets being 9-12 months (and up to 2 years).

Because of the coincidental timing of the US election, the four year cycle is also divided into four electoral periods, whose average pattern since 1900 looks like this.

Applied to recent times it gave this pattern, which kind of worked.

This patterns is supposed to work whoever wins. So longs for the influence of politics on economics.

In fact, the same cycle is seen in Europe too.

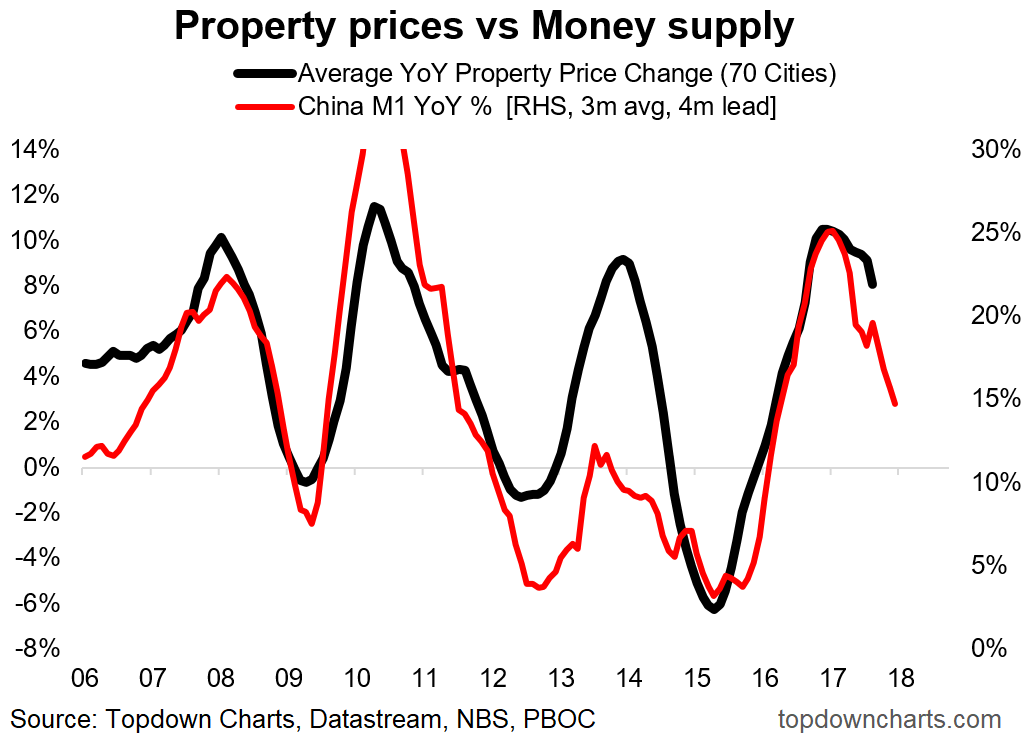
And in China.

1988, 1992, 1996, 2000, 2004, 2008, 2012, 2016, 2020 etc. the world changes, new presidents get elected, but the pattern looks the same.
4y presidential cycle
Y1 = 4% election year
Y2= 4.5% post election
Y3= 13.5% strongest year after mid term
Y4= 7% pre election


Comments
Post a Comment